Project description
This project explores the data about cars and technical inspection (roadworthiness testing, TI) results in Latvia, provides various descriptive analytics and draws conclusions about TI performance of different automobile brands and models.
The project uses open data provided by Road Traffic Safety Directorate of Latvia and published on the Open Data portal, it is accessible here: https://data.gov.lv/dati/lv/dataset/transportlidzeklu-registracijas and https://data.gov.lv/dati/lv/dataset/tehniskas-apskates. Data is available on 30th July 2021, therefore number of cars produced in 2021 is significantly less that it actually is and is not comparable to the other years. To limit the scope and reduce outliers impact on the charts, those filters were applied to the data:
- cars made only since 1980
- passengers cars only
- cars brands with at least 100 cars present
- full weight is greater than own weight (to remove erroneous data)
EDA of the cars in Latvia
Dataset description
Available data includes information about brand, model, used fuel, country of origin (country from there a car was imported), color, production year and weight (full and own). There are about 750 thsd. passenger cars.

Multivariate data exploration
Let’s explore what cars brands were imported from what countries.


From the data presented above, we can draw multiple conclusions:
- German brands dominates in all the cars and were mainly imported form the Germany. Only Volvo is in the top-5 between VW, Audi, BMW and Opel.
- Things are very different for the newer cars (produced in 2015 and later) - these cars were mainly purchased locally (in Latvia) and there is a new leader - Toyota, with Škoda and Nissan in the top-5.
- The overall trend is that for the majority of brands older cars are imported and newer cars bought locally.
- Even for the newer cars, for brands like Audi, Volvo, BMW and Mercedes only about 50% is bought in Latvia, other cars were imported.
- American brands were presented only by Ford, other brands (Chrysler, Chevrolet) were not sold in Latvia at least since 2015.
EDA of the technical inscpections results
Overall TI results
In this project we’ll inspect the TI done in 2021. Technical inspection in Latvia can have four different results, based on the severity of the identified problems, and is presented as a score:
- score 0 - no technical problems identified, no restrictions (positive outcome);
- score 1 - minor technical problems not affecting safety, no restrictions (positive outcome);
- score 2 - technical problems that should be repaired in 30 days period, repeated inspection is required (negative outcome);
- score 3 - severe technical problems, car is forbidden from being driven (negative outcome);
How prepared are cars owners when they arrive at the TI at the first time?

About 35% of the initial TI end with the negative outcome. Usually found problems are repaired and only 12% of the repeated inspections were negative.
Cars specific TI results
Here we will see at the three available characteristics of the cars and how they impact TI results - this is cars age, brand/model and cars used fuel. Because new cars in Latvia have two years period between the TI procedures, we will limit the observations only with cars produced in 2019 and earlier.
First, let’s look at the general results. Except for the odd results for cars produced in 2018, all results are as expected. With age it is harder to maintain a car in good conditions, but if the car “survived” long enough (more than 30 years) it becomes more looked after by it’s owner. We will keep the age factor for all further analysis because it looks as the major factor.
Taking into account fuel type, diesel cars looks harder to maintain compared to petrol cars.

Cars of which brand more frequently pass the TI?
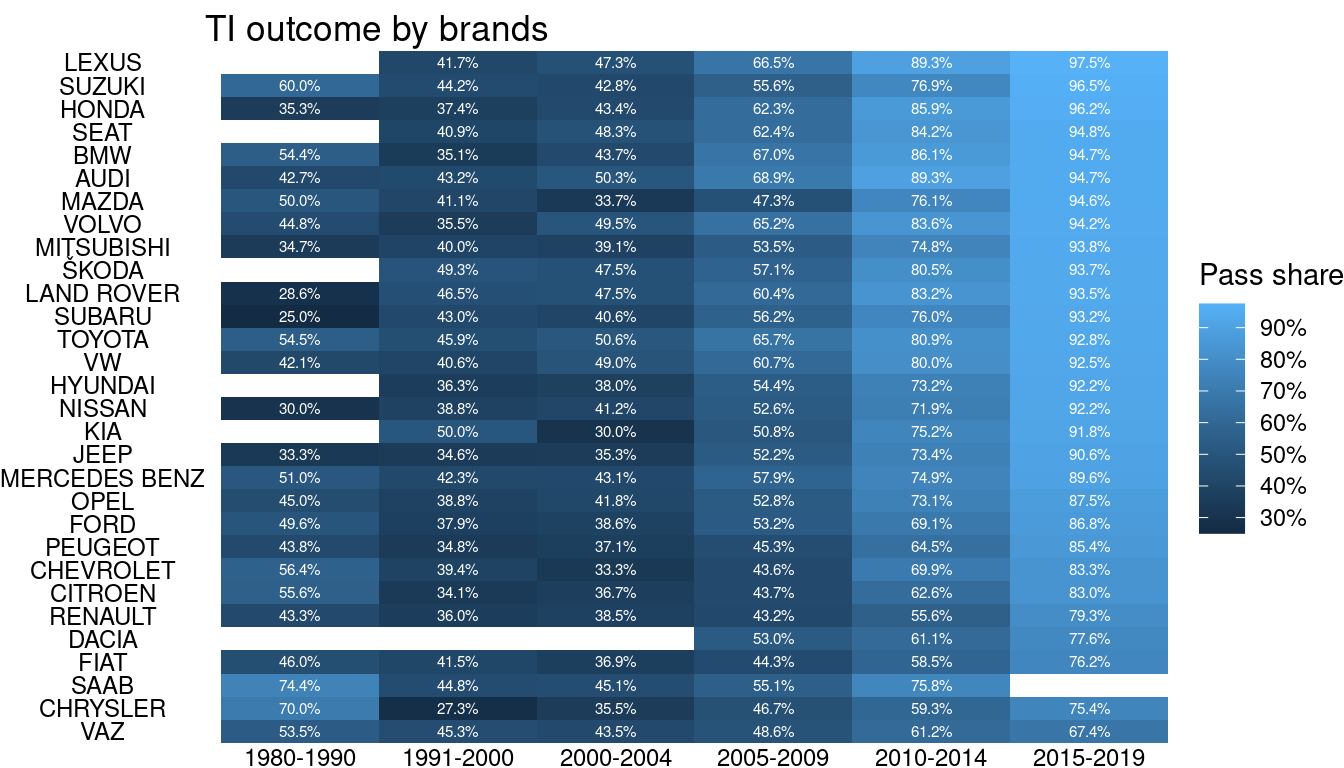
- Cars, produced in 2015-2019 (first seven years, TI was done in 2021). So, if you have a relatively new VAZ/LADA, there are bad news for you, these cars are by far more problematic in the first seven years after production. The leader is Lexus, followed by (surprisingly) Suzuki and Honda. Poor results for the Mercedes caused by a huge number of vans (Sprinter), so these are usually commercial cars, not the premium ones.
- Cars, produced in 2010-2014 (8 to 13 years). The leader is the same (Lexus has to share the first place with Audi), but there are new outsiders - Renault with only 55.6% of successful initial TI, Fiat with 58.7% and Chrysler with 59.3%. Even Lada’s are keeping whole better. Many brands see a fall in results by 20 percentage points.
- Cars, produced in 2005-2009 (14 to 19 years). A huge drop of quality for Mazda (down by 28.8 pp), bad news for the French cars (Peugeot , Citroen, Renault at or below the 45% level). Runners up are Toyota and Volvo.